The problem
Most people with a few jobs behind them end up with pensions scattered across several providers, plus an ISA or two and some savings. Each provider has its own website, its own statements and its own way of showing things. Getting a clear picture of the whole means logging in to everything and pulling it together by hand.
That's slow for anyone, and it gets in the way of a good conversation with a pensions adviser. You want the meeting to be about decisions, not about finding the latest figures.
What I built
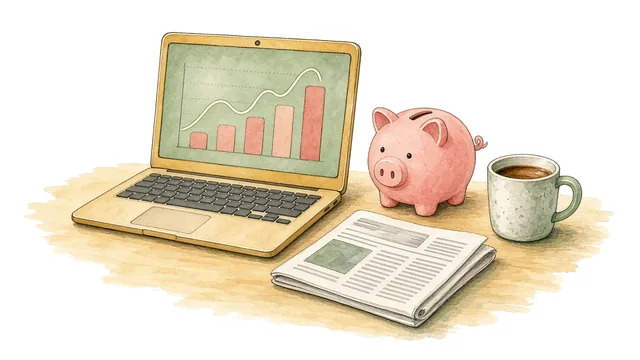
Everything on one page. The dashboard shows every pot at a glance: pensions, ISAs and cash. Each figure is entered once and updates everywhere it appears, so there's no risk of two versions of the same number.
A true picture of growth. Money paid in and taken out is recorded separately from growth. When money moves from one provider to another, it's recorded as a transfer, so it isn't mistaken for growth or a loss. That means the growth shown over time is real growth.
Simple to keep up to date. When a new statement arrives, the new figure goes in once, and the totals, the growth figures and the history all update themselves.
Nothing gets lost. The figures are saved automatically, a backup is taken before every change, and a simple log records what changed and when.
A weekly briefing to talk through. Once a week, a routine pulls together UK pension and tax news, general conditions in the gilt and bond markets, and updates about the funds being tracked. It sorts what it finds into three groups: "action required", "monitor" and "awareness only". These aren't instructions. They're a list of things worth raising with the adviser, so nothing important slips through the gaps between meetings.
Clear about what it is. The dashboard organises information and flags things to discuss. It doesn't make recommendations or decisions, and it isn't financial advice. Decisions stay where they belong, between the adviser and their client.
How it's going
The dashboard is in regular use, and the weekly briefing arrives every week. The biggest change is simple: instead of gathering figures from several websites before a meeting, the whole picture is on one page, with a short list of things to ask about.
It's also a good example of what I like building most: a small, private tool that does one job well and takes the busywork out of something important.